Progress Channel
Work that takes minutes is usually reported by whatever the agent happens to print — a carriage-returned counter in one terminal. That fails three ways: the only way to learn the state is to re-ask (pure overhead), the counter can lie (a stale fragment reads as a stall; submission-order iteration pins it at 0), and work handed to another system — a CI run, a media-server queue, a long download — has no representation at all.
This plugin makes a shared progress channel the default for all three, and the answer to "are we there yet" is a page, never a re-poll.
|
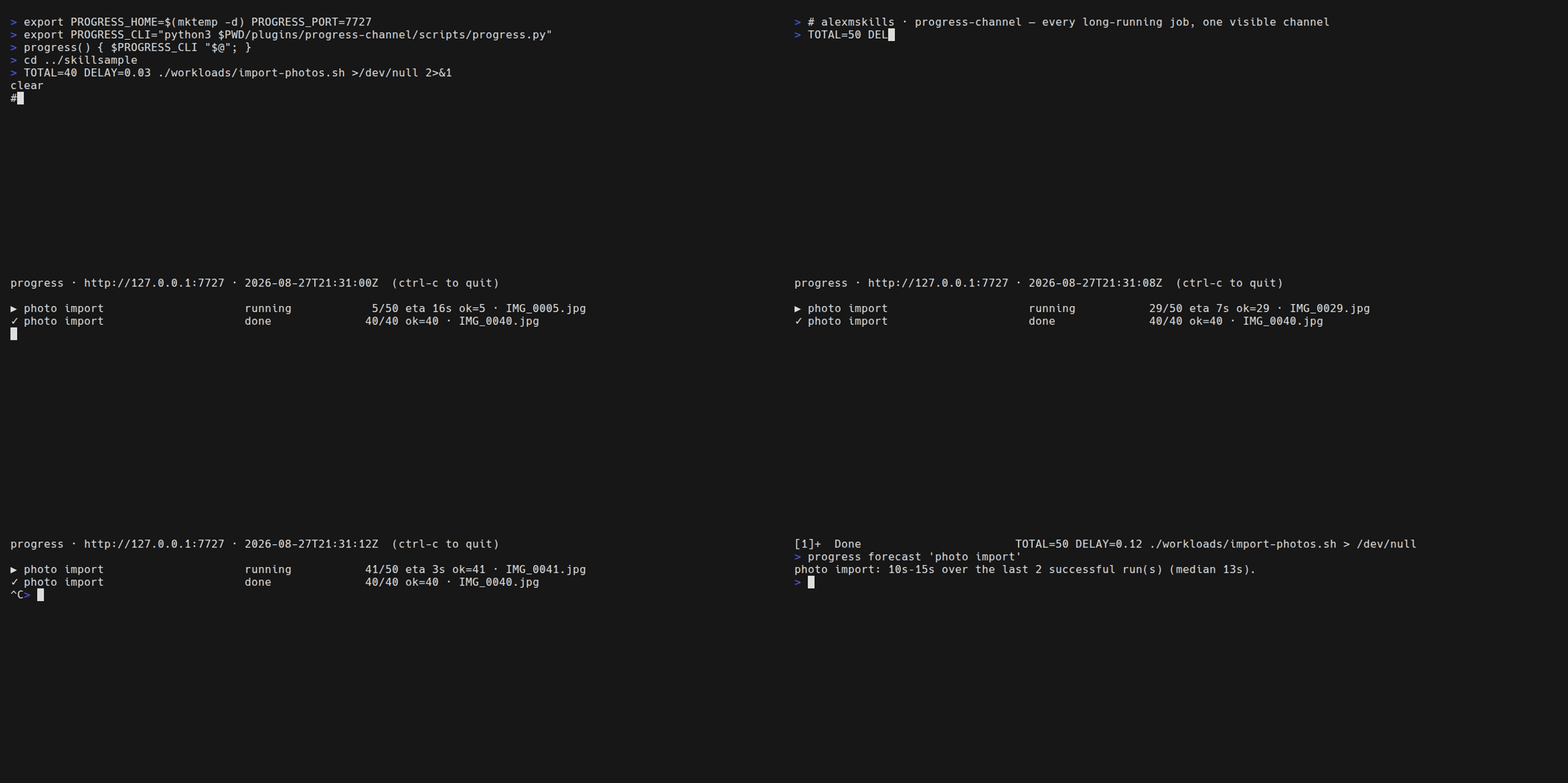
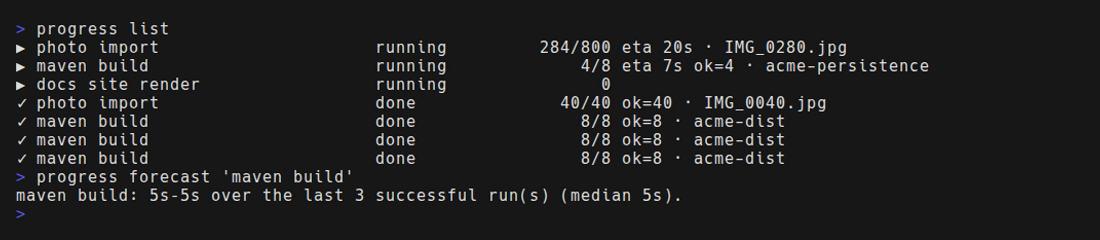
Two recorded demos ship next to the plugin, both run against the
skillsample demo stage:
the CLI demo GIF
(a workload registers itself, |
What it looks like
In Claude Code — the status line
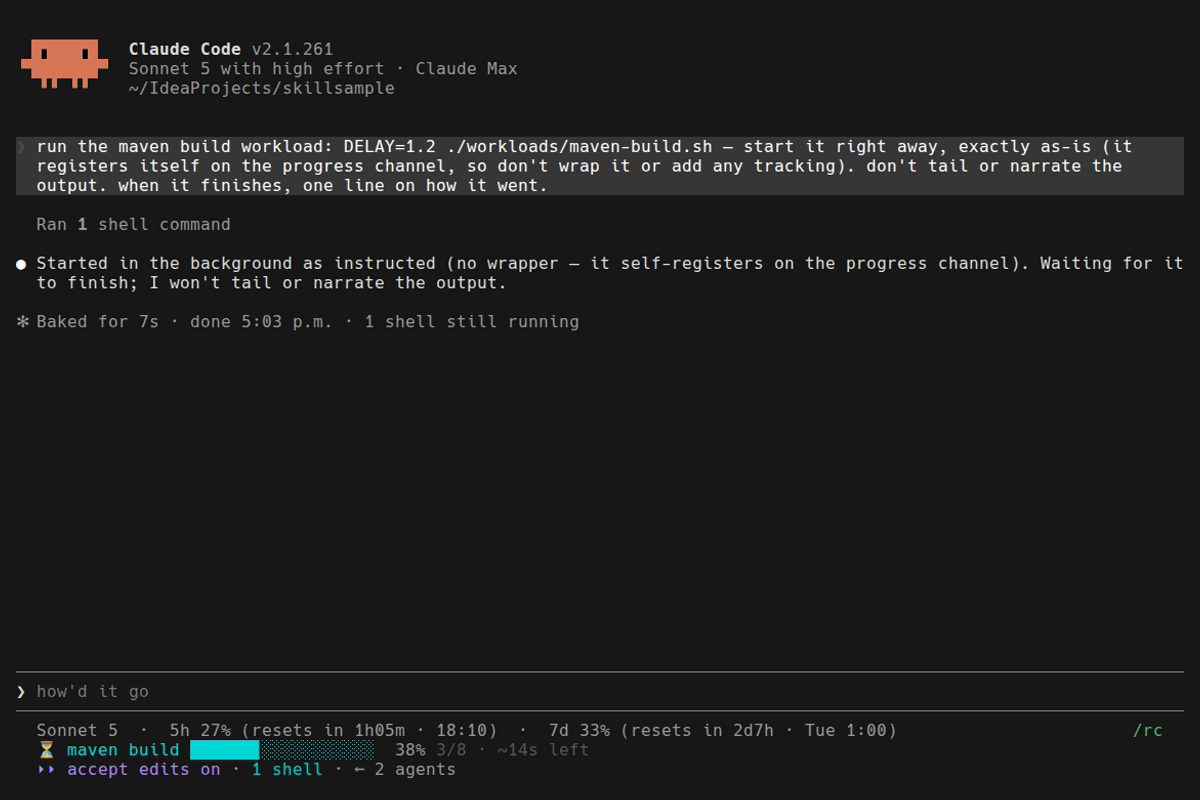
A job started from any tool call inherits the session id, so the session’s status line shows a live bar for its own work only (the status line is the one surface in the Claude Code window that supports colour and self-scheduled refresh). Here a real recorded session runs a simulated Maven reactor build: the build registers itself, Claude answers and moves on, and the bar fills with a live ETA — nobody re-polls, nobody narrates:
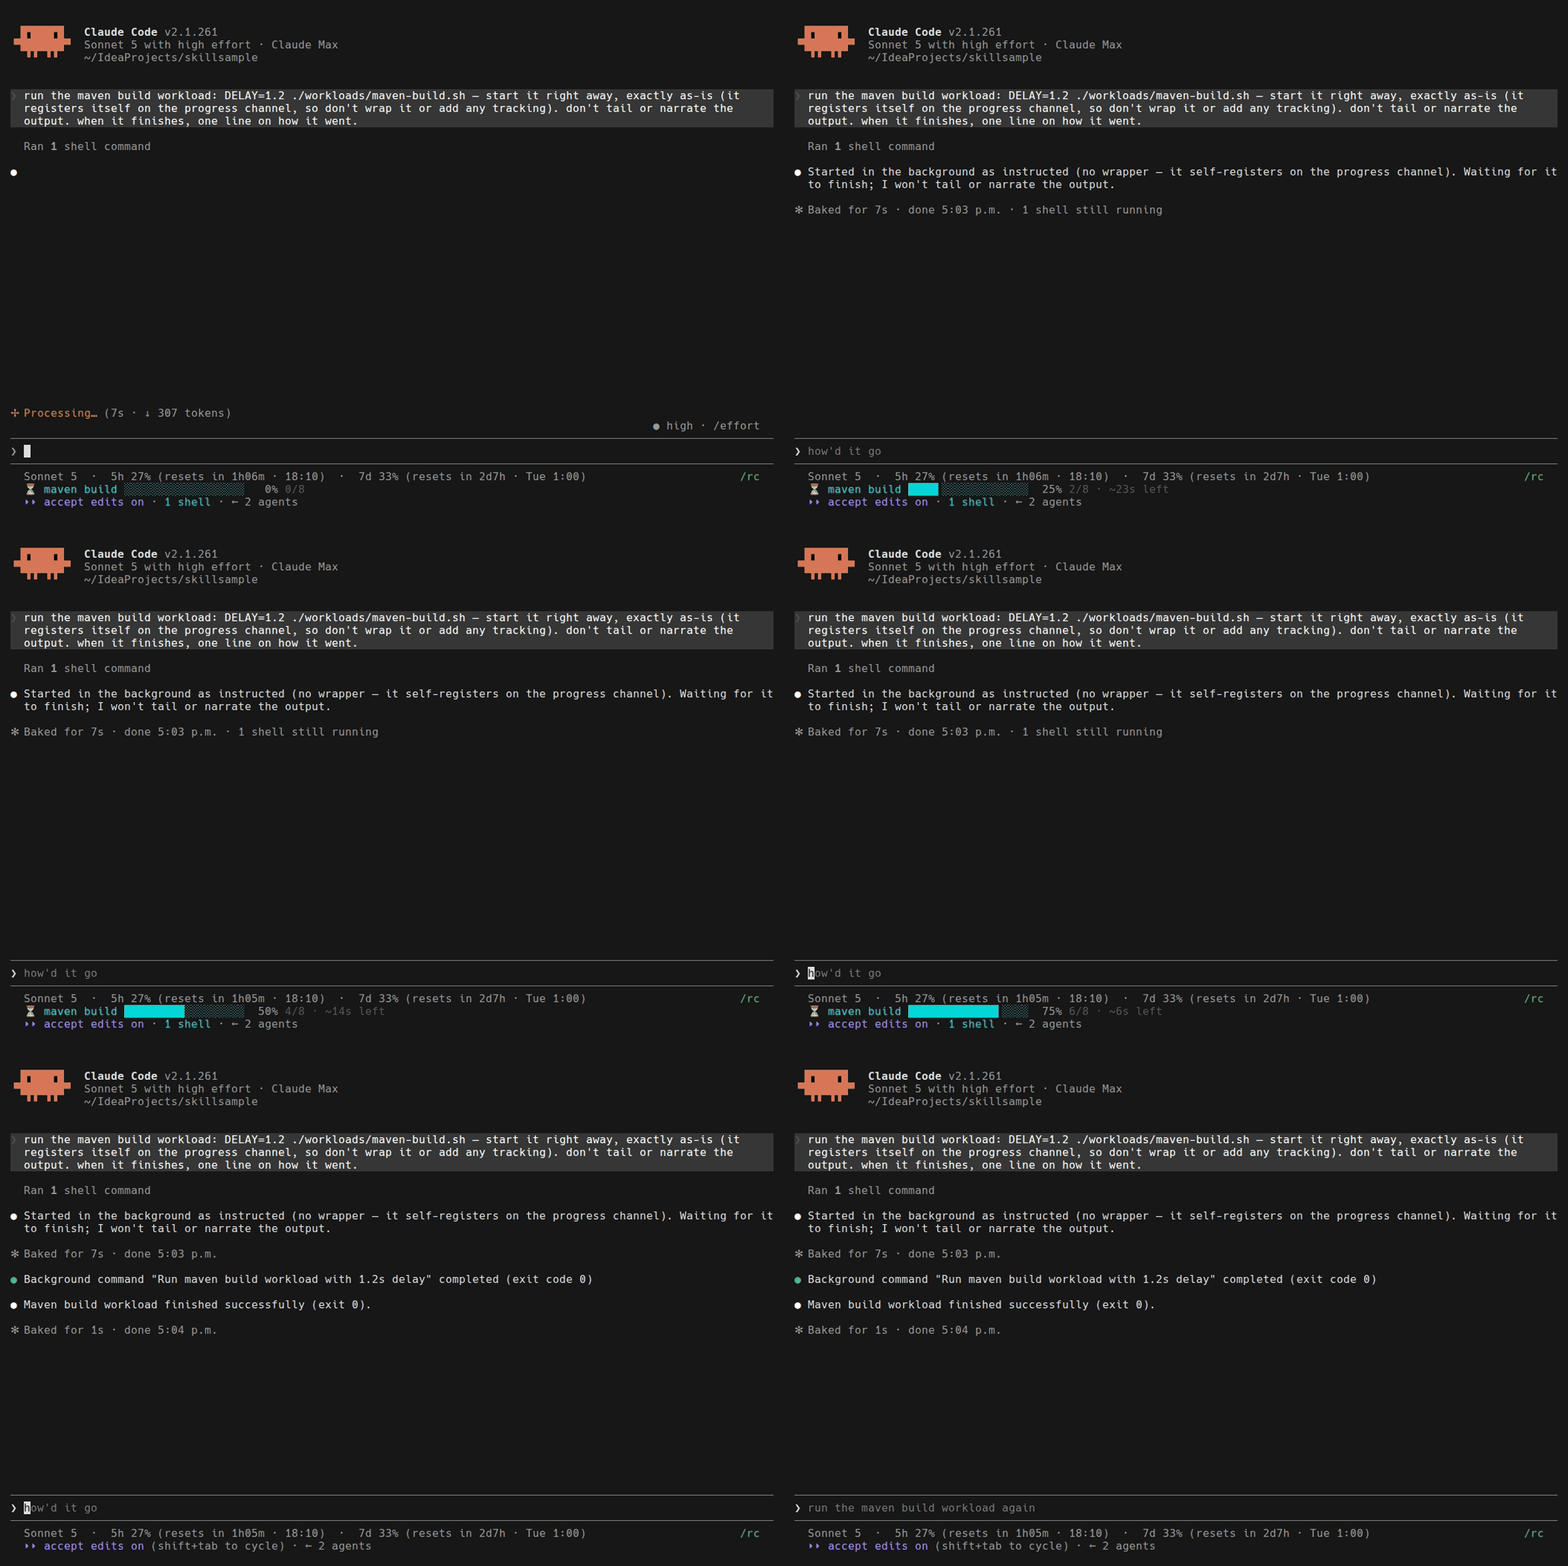
The recording. A still from it:
Wiring it up is one edit to ~/.claude/settings.json — or just ask Claude to "set up the progress status line" and it makes the edit for you (0.5.0):
{"statusLine": {"type": "command",
                "command": "python3 <plugin>/scripts/statusline.py",
                "refreshInterval": 1}}
Already have a status line? Wrap it instead — statusline_wrap.py — <your command> runs it unchanged and appends the progress rows. refreshInterval is what makes the bar animate.
From 0.7.0 the band above the prompt covers this with no setup. If you want the status line and never found it, 0.5.0 finds you: the daemon knows whether any status line has ever polled it (statusline_seen on /health — no settings are parsed), and while none has, the live page shows a one-line setup banner, the advisory nudge adds an at-most-weekly tip, and a once-per-install/upgrade session notice offers the setup.
In Claude Code — the band above the prompt (0.7.0)
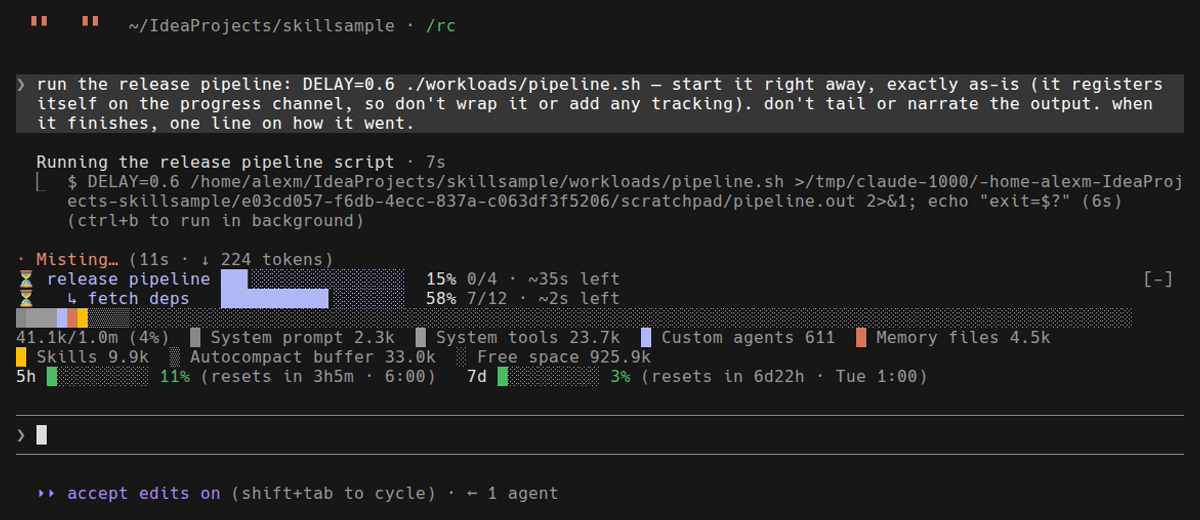
No setup at all: the plugin ships a mod that draws the same rows above the prompt. It loads with the plugin, has room for six rows, and lines the bars up in one column. This is a real recorded session with no status line configured — the pipeline and its running stage appear on their own:
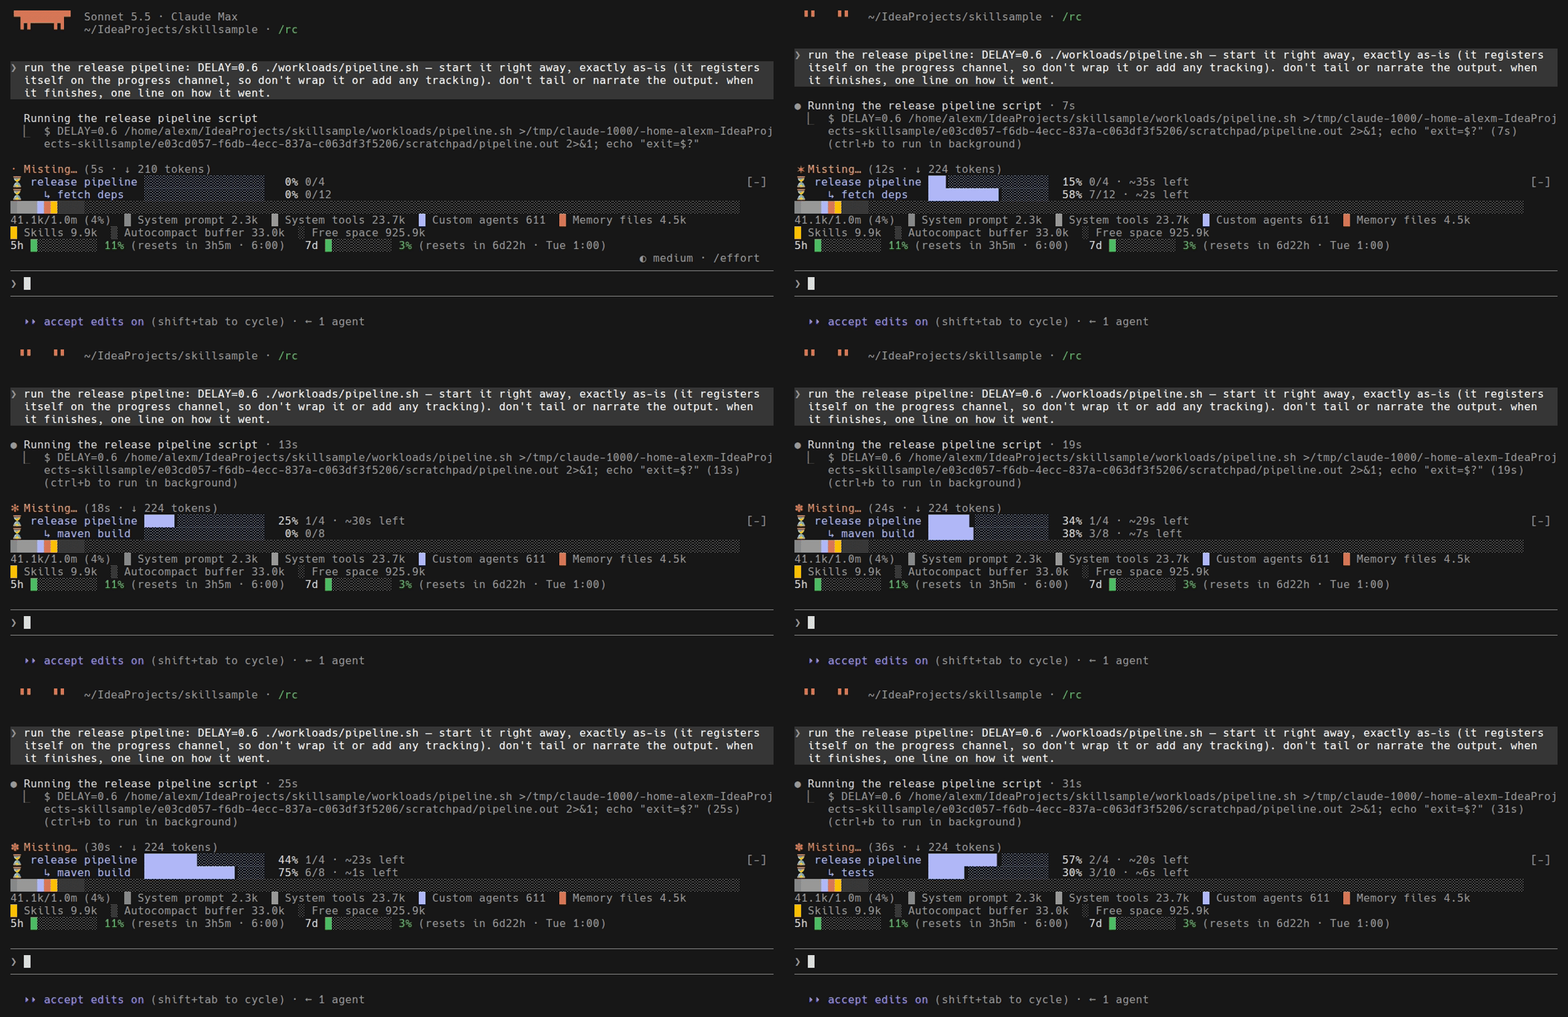
The recording. A still from it — the two rows at the top of the band are progress-channel; the rows beneath are the context-bar and usage-bar mods, stacked:
| Command | What it does |
|---|---|
|
Toggles the band. |
|
The default. The band draws only while no status line is polling the daemon, so a job is never drawn twice. Wire the status line and the band steps aside. |
|
Always draw, or never. The choice is remembered across sessions. |
The mod only reads. It asks the daemon on this machine for the session’s jobs once a second while one is live and every two seconds otherwise, and redraws only when a row would change. It never starts the daemon, sends nothing off the machine, and costs no tokens. Mods are Claude Code only; on Codex, use the status line or the page.



The live page
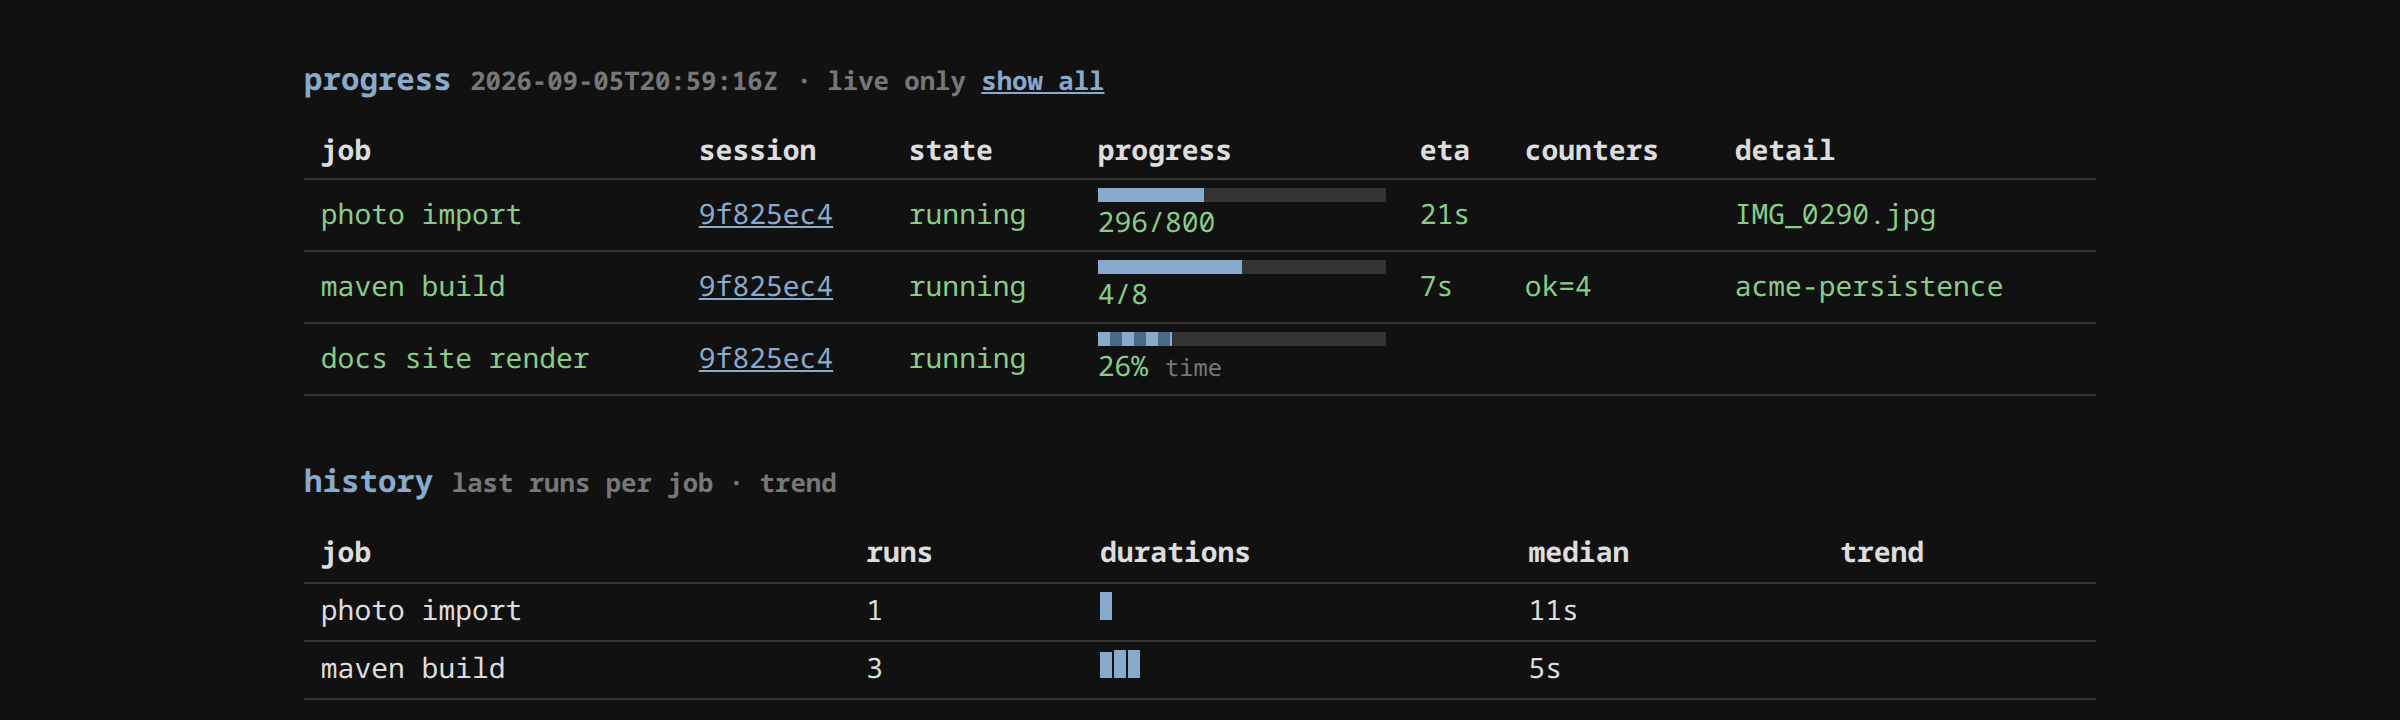
The daemon serves the tracker itself at http://127.0.0.1:7717/ — live jobs with
ETAs (counted 4/8, time-based 26% time, and estimate-labelled bars), plus
per-job duration history with sparklines and trend:
Install
/plugin install progress-channel@alexmskillsNothing to configure and no service to manage: the first registered job auto-spawns the daemon.
Architecture: the page server is the tracker
A stdlib-only Python daemon (http.server, zero dependencies) binds 127.0.0.1:7717 and holds live jobs in memory — a single writer, so there is no store and no locking at all. It serves the live HTML view at /, JSON at /jobs, and forecasts at /forecast?name=. Binding the port is the single-instance lease.
Upgrades restart the daemon by handshake (0.4.0): /health reports the plugin version, and a producer from a strictly newer install asks the old daemon to step aside (/shutdown, with a SIGTERM fallback for older daemons) and respawns the new code — live jobs survive because every producer re-registers on its next flush.
Only what must survive a restart is persisted: finished runs append to ~/.claude/progress/history.jsonl — the learning data, cat/jq-able, no database. Live state is memory-only on purpose: if the daemon restarts, producers re-register on their next flush (the producer is the source of truth for its own job); a reboot kills the jobs anyway. And a job never fails because the tracker is sick — an unreachable, unspawnable daemon degrades the job to a warn-once untracked no-op.
The discipline
-
Register anything expected to exceed ~10s — a sweep, a backgrounded command, a call that hands work elsewhere and returns early.
forecast <name>answers "how long has this taken before" prior to starting. -
Never answer a progress question by re-polling and narrating. Open the page, run
watch, orlistonce. -
External work gets a
mirrorwatcher — one small process polling the foreign system into the same channel, exiting when the work goes idle. One list, whatever the source.
Library and CLI
with Job('video integrity', total=10453) as j:
    for item in items:
        j.step(detail=item, ok=1)     # categorical counters: ok / truncated / ...
The job is a context manager — an exception reports failed; only a SIGKILL-class death goes silent, and the daemon’s sweep catches those by checking the producer’s pid directly (it is local, so no heartbeat protocol is needed). Flushes are throttled (every 50 steps or 1s, plus on exit), so a 10k-item loop is a handful of POSTs.
progress.py list                         # one-shot view
progress.py watch                        # live TUI
progress.py forecast <name>              # pre-start estimate from history
progress.py run --name build -- make all # wrap any command as a job
progress.py mirror --name 'immich metadata' --source immich-jobs \
    --poll-cmd '<status cmd>' --interval 30
progress.py daemon                       # foreground (debug); auto-spawned otherwise
mirror’s live job doubles as a lease: a second watcher for the same `--source refuses to start while the first is alive.
Tap: a bar from the tool’s own output (0.5.0, 14 more tools in 0.8.0)
progress_tap.py is a transparent pipe filter (generalized from the production tap in a large multi-module project’s build gate): stdin passes through byte-for-byte, and the position lines the tool already prints become the bar — the tool’s own count, not a time estimate:
mvn -B verify 2>&1              | progress_tap.py 'gate: full' > build.log
git clone --progress <url> 2>&1 | progress_tap.py 'clone linux' --pattern git
pytest 2>&1                     | progress_tap.py 'tests' --pattern pytest
cargo build 2>&1                | progress_tap.py 'build' --pattern cargo
docker build --progress=plain . 2>&1 | progress_tap.py 'image' --pattern docker| Kind | Patterns | What the tool prints |
|---|---|---|
Measured |
|
Done and total on the line — |
Percent |
|
Its own percentage — |
Counted |
|
One line per finished unit, with no denominator. The bar shows a count, and from the second run an estimate learned from the first. Pass |
ratio and percent cover a tool with no preset. Some tools print nothing into a pipe without a flag — Gradle needs --console=plain, Docker --progress=plain, rsync --info=progress2, git --progress; examples/taps.md has the full command for each tool and how to compute a total. A tool with no position output at all (npm install, ffmpeg) cannot be tapped: wrap it with run and the channel learns its duration instead.
Read ${PIPESTATUS[0]} for the build’s verdict (a pipeline’s $? is the tap’s). Daemon down? The tap degrades to cat, silently — a bar is never worth a broken build. An unknown pattern name is reported once on stderr instead of quietly matching nothing. The advisory nudge now suggests the tap with the right pattern and flag for each of these tools, and suggests run where no pattern exists.
From any script
Anything that can run a command can be a producer — no Python import needed:
T=$(progress.py start --name 'photo import' --total 800)
trap 'progress.py finish $T --fail "aborted"' ERR
for f in *.jpg; do
    convert "$f" ...
    progress.py step $T --count ok=1 --detail "$f"
done
progress.py finish $T
If the loop lives inside a shell function, use an EXIT trap instead — an ERR trap does not fire inside a function without set -E, so the job would be left for the orphan sweep.
start prints a token; the cross-invocation state lives in a token file, so step is stateless for the script and keeps the library’s 1s POST throttle. Liveness anchors to the calling script’s pid — a script that dies without finish is swept as orphaned like any other producer.
Integration examples (0.8.0)
The plugin ships small runnable producers in examples/. Each is a complete program: copy it, replace the sleep with your work, and it reports itself. Each also runs the same with no channel — unset PROGRESS_CLI and it is a plain script — which is the pattern worth copying.
| You have | Start from | It shows |
|---|---|---|
a shell loop |
|
start / step / finish, counters, a failure reported with where it stopped |
a multi-stage script |
|
stages nested under a parent with one |
Python |
|
the |
Node / TypeScript |
|
calling the CLI from another language, batching steps |
Go |
|
the same three calls, and a deferred finish that reports a panic |
a Makefile |
|
wrapping targets as timed jobs |
a build or test tool |
|
one pipe per tool |
No library is needed in any language. The contract is three CLI calls:
start  --name <text> [--total N] [--pid PID]      -> prints a token
step   <token> [-n N | --done N] [--detail text] [--count key=N]
finish <token> [--fail "why" | --cancel]
Four habits the examples share:
-
Close the job on every way out —
trap … EXITin shell, a context manager in Python,try/catchin Node,deferin Go. -
Say who owns the job when you are not the direct caller. The channel watches the process that started a job. From Node or Go, and from a shell function called inside
$( ), that is a short-lived child, so pass--pidwith the long-lived process’s pid. Without it the job is swept as orphaned while the work is still running. -
Batch steps in a hot loop. Each CLI call is a process;
step -n 50every fifty items costs one. -
Never let the tracker fail the work. Every helper swallows its own errors and returns an empty token.
Every example is run by the plugin’s test harness, with the channel and without it.
Sub-jobs: a pipeline and its current step (0.6.0)
A job can run inside another, and every surface — the status line, the page, list — shows it nested under its parent:
⏳ pipeline rome (italy) #119 ██████████████▏░░░  79% 26/34
⏳   ↳ ground-round ███████████████▉░░  89% 549/619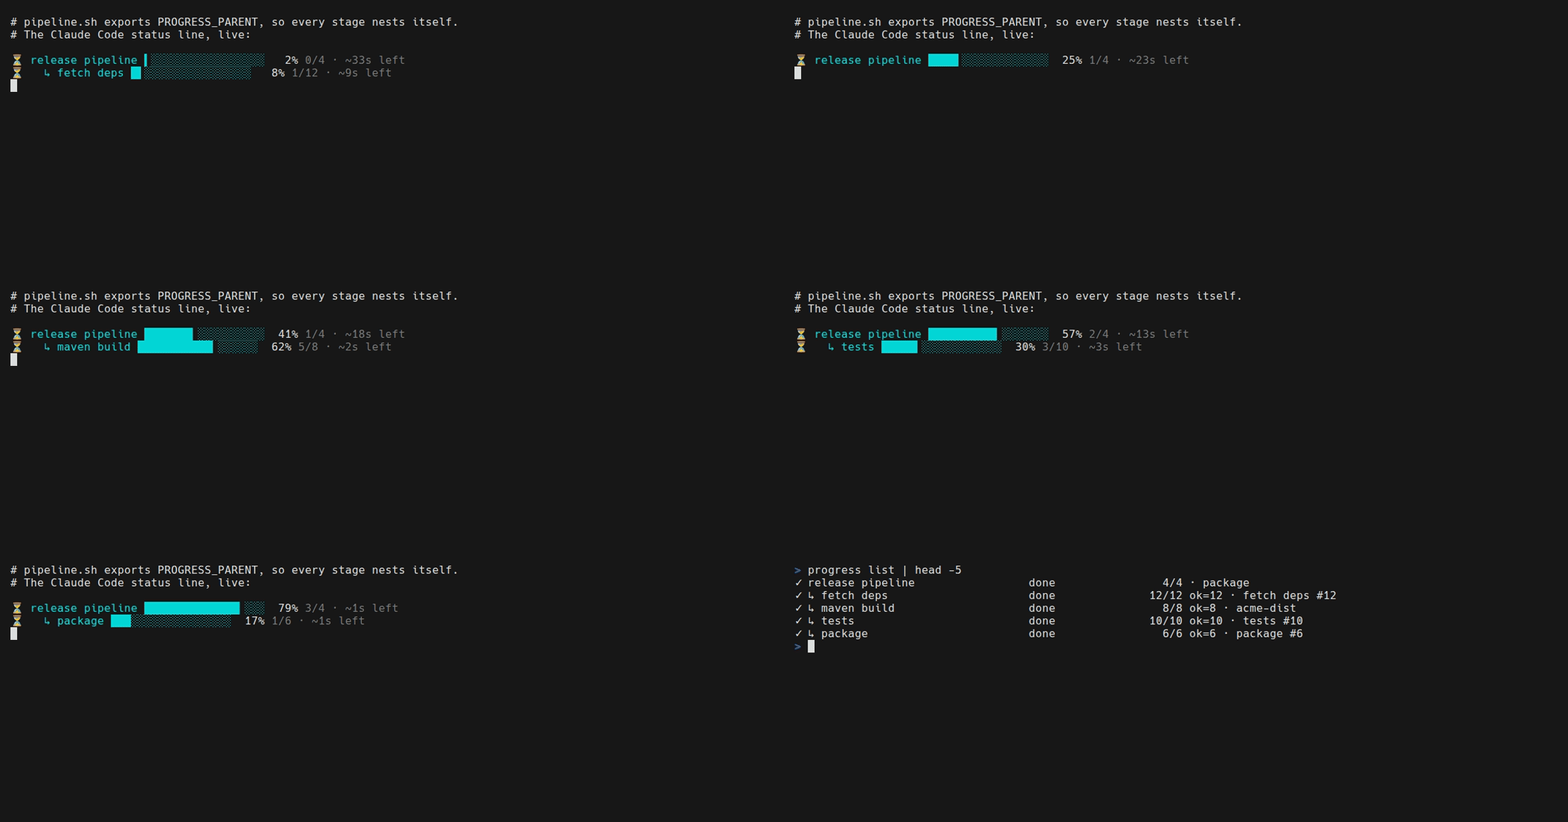

with Job('pipeline rome', total=34) as p:
    for step in steps:
        with p.child(step.name, total=step.size) as c:
            ...
T=$(progress start --name 'pipeline rome' --total 34)
export PROGRESS_PARENT=$T # every sub-script below nests itself
C=$(progress start --name ground-round --total 619) # or: --parent $T
progress finish $T # also cancels any child still open-
The parent bar rolls up. A counted parent with running, counted children reads
(done + child fractions) / total, labelled+sub— 79% above, instead of a bar stuck at 76% for the whole step. Estimated children never move a counted bar. -
Time left rolls up too: the running step’s own time-left plus the remaining whole steps at the parent’s per-step rate — the parent alone would treat the in-flight step as untouched.
-
Closing cascades from the producer. Exiting a parent’s
withblock, orfinishon its token, closes any open child first, ascancelledwith the reason. A child whose parent ended without cascading stays visible at the top level, labelled — never hidden. -
The child keeps its plain name, so
ground-roundlearns one duration whether it ran nested or on its own. -
Mirrors take sub-steps from an optional second
--poll-cmdline,<done> <total> <name>. -
The status line keeps its 3-row cap: every top-level job gets a row first, and a child left without a row is folded onto its parent’s line.
This replaces a manual pattern — two top-level jobs with the child’s indent typed into its name — that broke three ways: the child jumped above its parent whenever it stepped last, cancelling the parent left the child dangling, and the arrowed name learned no ETA from standalone runs.
What makes it more than a table
Duration history is keyed by job shape — name + kind + order-of-magnitude of total — capped at the last 20 runs per shape, so a sweep over videos and one over thumbnails under the same name never blend into a meaningless median.
| Signal | How it is derived |
|---|---|
ETA |
Before ~10% progress: median per-item rate of past same-shape runs. Past it, the current run’s own observed rate takes over. A first run shows no estimate rather than extrapolating. |
Pre-start forecast |
|
Borrowed estimate ( |
A job whose exact name never ran borrows the median of similar jobs: the name is normalized to a stem (paths dropped, digits stripped — |
Retention (0.4.0) |
A name with no run in the last 7 days ( |
stalled ⏸ |
Silent longer than 3× the job’s own learned p95 inter-step gap (floor 30s). A job whose gaps are always long is not stalled — the threshold is learned per job, and a job with no history is never called stalled. |
orphaned ☠ |
The producer’s pid is dead — killed too hard for the context manager to report. The daemon’s sweep adjudicates these actively instead of trusting |
Notifications, MCP, and the advisory hook (0.2.0)
-
Notifications — an executable at
~/.claude/progress/notifyis the entire configuration: the daemon runs it detached on everydone/failed/orphaned/stalledtransition (stalls once per episode) withPROGRESS_EVENT,PROGRESS_NAME,PROGRESS_ERRORetc. in the environment. Point it atnotify-send, an email sender, anything. -
MCP —
scripts/progress_mcp.pyis a stdio MCP server exposingprogress_list/progress_forecast/progress_start/progress_step/progress_finish— a thin face on the daemon’s HTTP API, so agent sessions read the channel as native tools. -
Advisory hook — a shipped
PreToolUsehook nudges (never rewrites) when a Bash command deserves tracking: the channel’s own history says this command shape runs long (the learned threshold), or it matches a static long-runner list / is backgrounded. -
Trend + sparklines — the page’s history section shows per-job duration sparklines and a trend tag ("slowing +40%") when recent same-shape runs drift from the older baseline;
forecastprints the same.runtees the command’s last output lines into the row, so a failed job shows why.
Verify
python3 <plugin>/scripts/test-harness.py — 229 checks against a real daemon on an ephemeral port (auto-spawn, crash semantics, SIGKILL orphan sweep, throttling, shape-keyed history, ETA cutover, restart re-registration, lease refusal, degraded mode, concurrent producers, the shell start/step/finish trio, notify hook, trend detection, MCP handshake, advisory hook, status-line rendering, eta~ stem matching, retention, the upgrade handshake, the tap’s passthrough and Maven/git parsing, statusline_seen discovery, the whats-new notice, the wrap script). Runs in CI.
Claude Code vs Codex
Tier 3 — lifecycle hooks on both clients.
| Claude Code | Codex | |
|---|---|---|
Live bars |
In the Claude Code status line ( |
In the browser dashboard or |
Hooks |
SessionStart what’s-new notice, PreToolUse long-command nudge. |
The same two, via |
Session scoping |
|
|
Tracker |
Registration, learned ETAs, history, stall/orphan detection, notifications. |
All identical — the daemon is client-independent. |
The difference that matters: Everything but the in-window bar works the same. Don’t write status-line config into Codex or promise animation inside Codex chat.
Install, hook trust and verified limits: Codex compatibility.